Debugging the virtual FlexPendant |
When debugging your application it is often convenient to use the virtual environment, but it is almost as easy to attach the Visual Studio debugger to the real FlexPendant device. For information about how that is done see Debugging the FlexPendant device.
This section describes how to start the Visual Studio debugger, attach a running Virtual FlexPendant to it, set up break points and step through the source code of a FlexPendant application.
Debugging procedureThere are several ways of attaching a Visual Studio debugger to a running Virtual FlexPendant application. In this section one method is described in detail.
There is no way to start your FlexPendant application from inside the Visual Studio environment. You must start by deploying the application to the Virtual FlexPendant in RobotStudio. How to do this is described in Hands on-Hello world Then you start the Virtual FlexPendant and attach the Visual Studio debugger to it.
In order to use break points the project build configuration must be Debug . You set it in the the Build tab of the Project Properties. The output directory, where you find the assembly (*.dll), the proxy assembly (*gtpu.dll) and the program database (*.pdb) is the bin/Debug directory, a sub-directory of your Visual Studio project. |
When you have a running application on the Virtual FlexPendant follow these steps:
Step | Action |
|---|---|
1 | In Visual Studio on the Debug menu, select Attach to Process. It brings up this dialog: 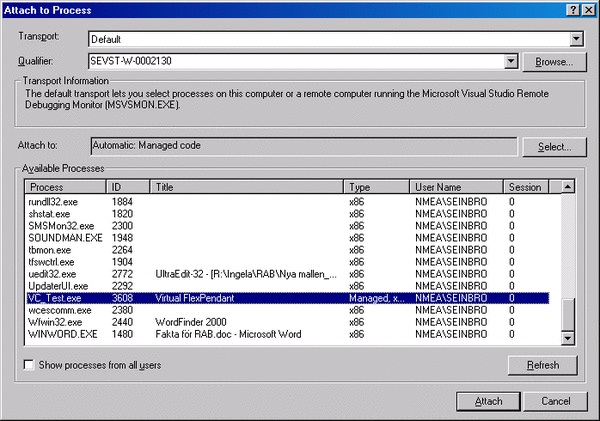 |
2 | Select the Vitrual FlexPendant.exe process and click the Attach button. |
3 | Set a break point in your source code. |
4 | On the Virtual FlexPendant, click a button of your application or something else that will make program execution hit the breakpoint. |
5 | On the Debug menu, point at Windows and select the debugging information to be displayed while debugging. See following example: 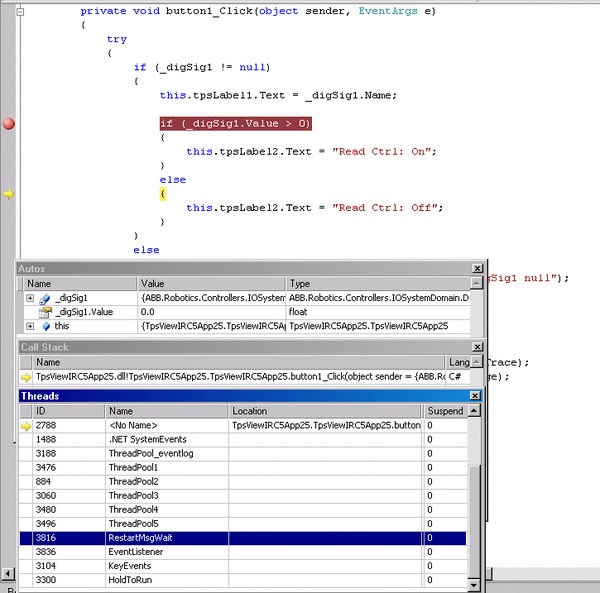 |
6 | On the Debug menu, select the appropriate Step command when stepping through your code. |
7 | On the Debug menu, click Detach All or Stop Debugging when you want to stop debugging. |
You can also attach a running application through the Windows Task Manager.
Step | |
|---|---|
1 | Start Windows Task Manager and select the Processes tab. 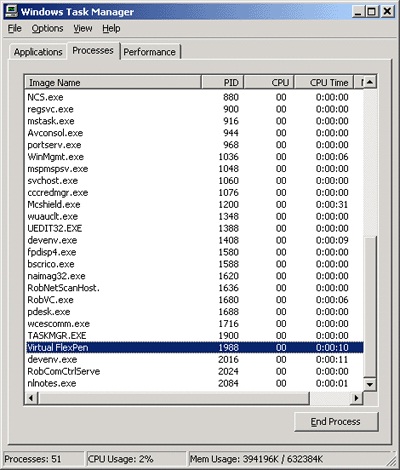 |
2 | Select the Virtual FlexPendant.exe process and right-click to get the context menu. In that menu select Debug. You will get a warning message, but select Yes. |
3 | A Just-In-Time Debugging dialog will appear. Select your application project as the debugger to use. |
Yet another way of attaching a debugger is to launch it programatically, by writing code in your application.
Step | Action |
|---|---|
Insert the following line where you want the debugger to start: System.Diagnostics.Debugger.Launch() | |
Start the application in the Virtual FlexPendant and perform the action which is to launch the debugger. A Just- In-Time Debugging dialog will appear. | |
Select your Visual Studio project as the debugger. Click OK and start the debug session. |