Debugging a SmartComponent
This topic showcases how to debug a SmartComponent using Visual Studio. For the purposes of this topic, it is assumed that the developer has already created and compiled a SmartComponent using Visual Studio. If this is not the case, please refer to Creating a SmartComponent.
The steps that we will follow in this topic are the following:
- Make sure the "Solution Configuration" is set to "Debug" in Visual Studio.
- On RobotStudio, select either an already-made file or just create an empty station.
- If the desired SmartComponent was not automatically loaded with the selected station, load the .rslib file.
- Control the execution of the process using RobotStudio's controls.
- Select the desired process and thread to visualize information about it.
SmartComponent debugging
Using Visual Studio, make sure that the "Solution Configuration" is set to "Debug". Press the "Start" button. A RobotStudio instance will execute.

Once RobotStudio's interface loads, open an already-made project or create an empty station.
If the desired SmartComponent was not automatically loaded with the selected station, load the .rslib file using the "Import Library" option from the "Home" tab in the standard RobotStudio menu.

Visual Studio's default debugging controls allow the user to control the execution of the RobotStudio instance that is used for debugging purposes. When paused, the user can select the execution thread of the SmartComponent, as well as gain information from it or from the RobotStudio process itself. The desired process (RobotStudio instance), can be selected from the drop-down menu To view the desired information pertaining the SmartComponent, please ensure that the desired process

as well as the desired thread

are selected in Visual Studio's debugging menu (if debugging several threads at the same time).
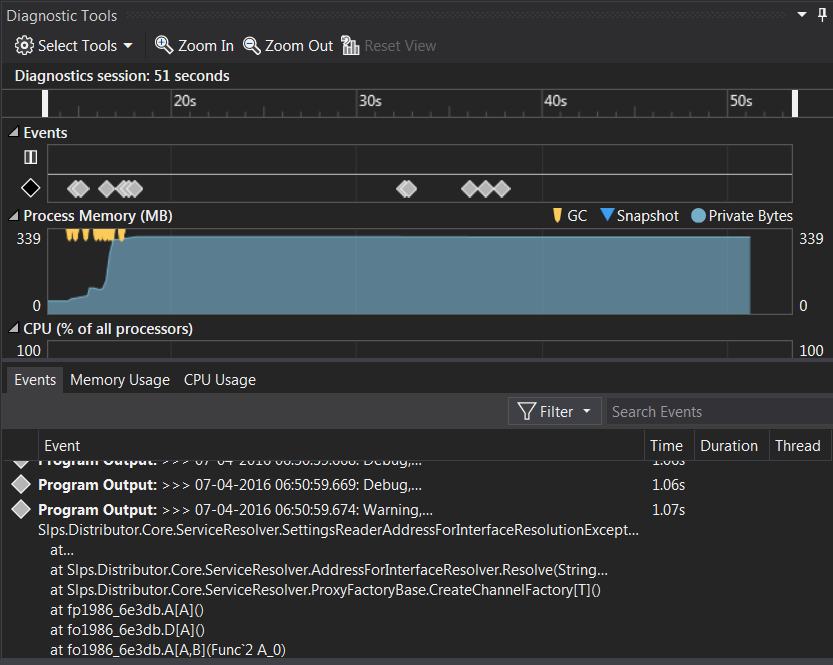
With the desired process and thread selected, refer to the Debugging tools window (Debug>Windows>Show Diagnostic Tools). A time lapse graph showcasing performance metrics from the process, as well as a graphical log of the events triggered by RobotStudio and the SmartComponent can be seen from here. "Resource Utilization Analytics", as well as "Event Logging" are available in Visual Studio's debugging tools. The Events, generated as part of RobotStudio's output, can display useful information pertaining the debugged SmartComponent.
RobotStudio's SmartComponents are debugged with the standard Microsoft's .net libraries. To call the aforementioned functionality, include the System.Diagnosis library in the SmartComponent's CodeBehind.cs.
Example
The following SmartComponent's code outputs a debug message as soon as it is loaded into RobotStudio:
using System;
using System.Collections.Generic;
using System.Text;

using ABB.Robotics.Math;
using ABB.Robotics.RobotStudio;
using ABB.Robotics.RobotStudio.Stations;

using System.Diagnostics;

namespace SmartComponent1
{
    public class CodeBehind : SmartComponentCodeBehind
    {
        public override void OnLoad(SmartComponent component)
        {
            base.OnLoad(component);
            Debug.WriteLine("Hello RobotStudio! This is a debug message.");
        }
    }
}
